Impervious surfaces like roads and rooftops do not allow water to pass through them. This leads to a variety of harmful impacts on local streams and wildlife.
Tar Print uses a machine learning model to quantify the amount of pervious or impervious surfaces in a region – completely automating the process.
Tar Print's sreamlined process of calculating surface types is much easier for student researchers to use than other programs which require years of experience.
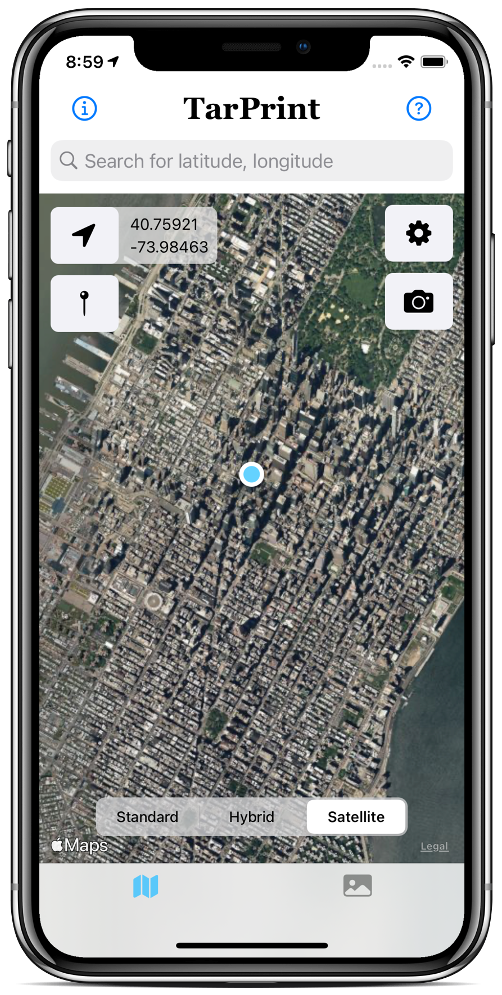
Tar Print offers two methods of location specification – using location services or dropping a pin. If your location services are enabled for Tar Print, you will automatically be zoomed into your current locaction when you use the app. If you are at a stream testing location while using Tar Print, this is an extremely fast way of getting the data you need. Tar Print also generates the current coordinates for your documentation.
You can alo use pins to mark a location on the map. Either type in the coordinate of your desired location, or click the pin button to drop a pin on the center of your screen.
After you have a location, click on the gear button to change settings. Here you will be able to change the side length of your snapshot capture in miles, and you can specify if you would like to analyze the surfaces around either your current location or your pin.
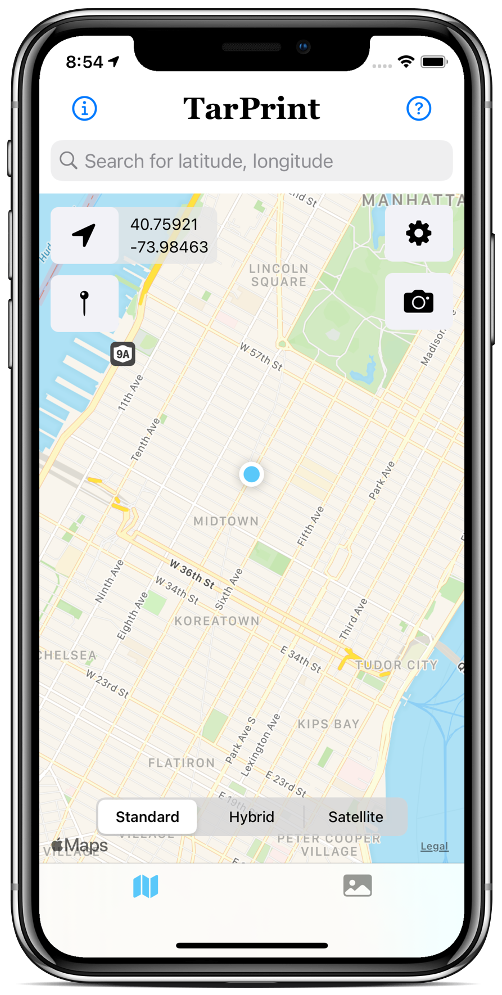
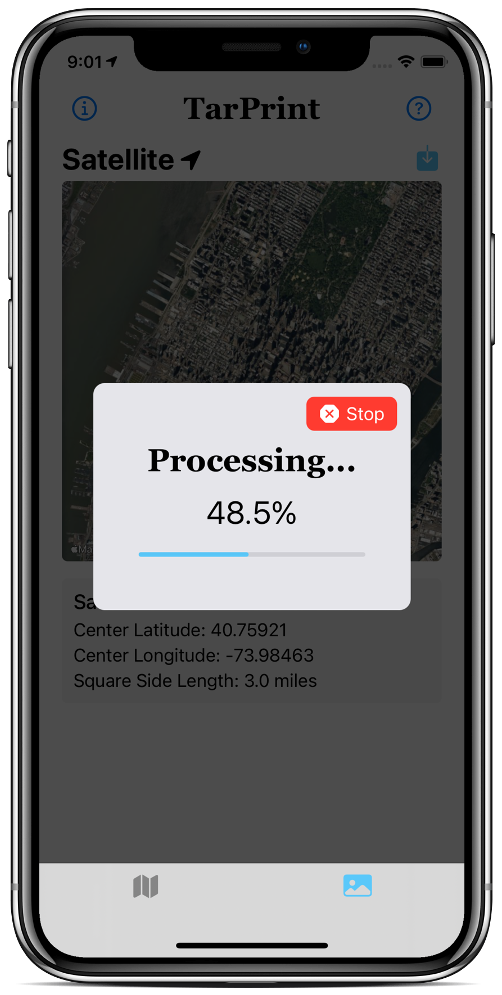
When you are ready to take your snapshot, all you have to do is click the camera button. This will capture the area around the specified location with the specified radius. Once it does that, the magic begins!
After the snapshot is taken, the image is analyzed pixel by pixel. Each pixel is run through a machine learning model which was trained by over 2,000 data points. Once each pixel is passed through, it is classified as pervious or impervious. To maximize results, Tar Print compares pixels against Apple Maps water surface data so it only classifies terrestrial surfaces.
Once each pixel is evaluated, all classified pixels are summed to find out the percentages of water, pervious, or impervious surfaces.
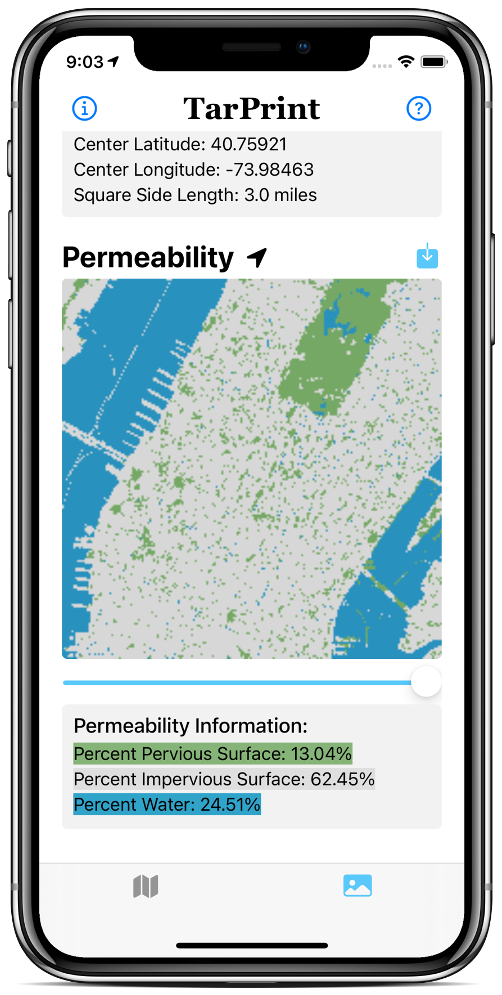
Once the processing window closes, a satellite image and a permeability image become visible. The satellite image shows an image centered around the specified location. The permeability image is classified pixel by pixel with a color that represents water, pervious, or impervious surfaces. The percentages of each type and key that pertains to them is also shown below.
Users are also able to save both the satellite image and the permeability image to their photos library on their phone.